一、canvas 与 SVG的区别
- canvas和svg之间一个重要的区别:使用canvas来绘制图形是通过调用它提供的方法,而使用svg绘制图形是通过构建一棵XML元素树来实现
二、canvas基础
note: (摘自《javascript权威指南》)
1、定义上下文对象
- 大部分画布绘制的API都不是在
<canvas>元素自身上定义的,而是定义在一个”绘制上下文”对象上,获取该对象可以通过调用画布的getContext()方法。1
2let canvas = document.getElementById('canvas');
let ctx = canvas.getContext('2d');
2、 绘制线段和填充多边形
- 图形属性
- fillStyle:填充颜色/渐变/图案等样式
- font:绘制文本css样式
- globalAlpha:绘制像素时要添加的透明度 (?)
- globalCompositeOperation:如何合并新的像素点和下面的像素点 (?)
- lineCap:如何渲染线段末端
- lineJoin:如何渲染顶点
- lineWidth:外框线的宽度
- miterLimit:紧急斜接顶点的最大长度 (?)
- textAlign:文本水平对齐方式
- textBaseline:文本垂直对齐方式
- shadowBlur:阴影的清晰或模糊程度
- shadowColor:下拉阴影的颜色
- shadowOffsetX:阴影的水平偏移量
- shadowOffsetY:阴影的垂直偏移量
- strokeStyle:勾勒线段时的颜色/渐变/图案等样式
案例:
1
2
3
4
5
6
7
8
9
10
11
12
13
14
15
16
17
18
19
20
21
22
23
24
25
26
27
28
29
30
31
32
33
34
35
36
37// 定义一个以(x, y)为中心, 半径为r的规则n边形
// 每个顶点都是均匀分布在圆周上
// 将第一个顶点放置在最上面,或者指定一定角度
// 除非最后一个参数是true,否则顺时针旋转
function polygon(c, n, x, y, r, angle, counterclockwise){
angle = angle || 0;
counterclockwise = counterclockwise || false;
ctx.moveTo(x + r * Math.sin(angle), // 从第一个顶点开始一条新的路径
y - r * Math.cos(angle)); // 使用三角形计算位置
let delta = 2 * Math.PI / n; // 两个顶点之间的夹角
for(let i = 1; i < n; i ++){ // 循环剩余的每个顶点
angle += counterclockwise ? -delta : delta; // 调整角度
ctx.lineTo(x + r * Math.sin(angle), // 以下个顶点为端点添加线段
y - r * Math.cos(angle));
}
ctx.closePath(); // 将最后一个顶点和起点连接起来
}
ctx.beginPath();
let x = 50;
polygon(ctx, 3, x, 70, 50); // 三角形
polygon(ctx, 4, x + x * 2, 60, 50, Math.PI / 4); // 正方形
polygon(ctx, 5, x + x * 3, 55, 50); // 五边形
polygon(ctx, 6, x + x * 4, 53, 50, Math.PI / 6); // 六边形
polygon(ctx, 4, x + x * 5, 53, 20, Math.PI / 4, true); // 六边形中的小正方形
ctx.fillStyle() = '#ccc'; // 内部填充颜色
ctx.stockStyle = '#oo8'; // 边框颜色
ctx.lineWidth = 5; // 边框跨度
ctx.fill(); // 填充
ctx.stroke(); // 勾勒外边框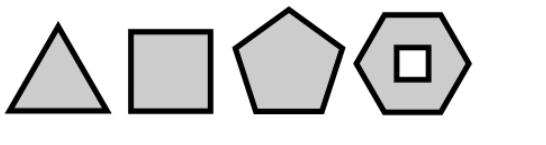
(效果图)
3、画布的尺寸与坐标
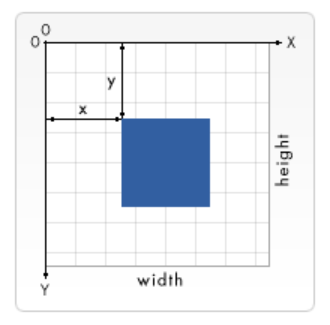
(注:图片来自MDN)
4、坐标系变换(占坑)
5、绘制和填充曲线
- arc(ox, oy, radius, startRadian, endRadian, [true | false]): 在当前子路径中添加一条弧
- 参数:
- ox: 圆心x坐标
- oy: 圆心y坐标
- radius: 半径
- startRadian: 起始弧
- endRadian: 结束弧
- true: 逆时针 | false: 顺时针
- 参数:
- arcTo(x1, y1, x2, y2, radius):绘制一条直线和一段圆弧
- x1: 起点x坐标
- y1: 起点y坐标
- x2: 终点x坐标
- y2: 终点y坐标
- radius:半径
- bezierCurveTo(cp1x, cp1y, cp2x, cp2y, x, y):实现在当前子路径中添加一个新的点,并利用三次贝塞尔曲线将它和当前点相连(?)
- cp1x: 第一个控制点x坐标
- cp1y: 第一个控制点y坐标
- cp2x: 第二个控制点x坐标
- cp2y: 第二个控制点y坐标
- x: 结束点x坐标
- y: 结束点y坐标
quadraticCurveTo(cpx, cpy, x, y):与bezierCurveTo()类似,不同的是它使用的是二次贝塞尔曲线而不是三次贝塞尔曲线并且只有一个控制点(?)
- cpx: 控制点x坐标
- cpy: 控制点y坐标
- x: 结束点x坐标
- y: 结束点y坐标
示例:
1
2
3
4
5
6
7
8
9
10
11
12
13
14
15
16
17
18
19
20
21
22
23
24
25
26
27
28
29
30
31
32
33
34
35
36
37
38
39
40
41
42// 将角度转化成弧度制
function rads(x){
return Math.PI * x / 180;
}
// 圆形
ctx.beginPath();
ctx.arc(75, 100, 50, 0, rads(360), false); // 圆心位于(75, 100), 半径为50, 从0°到360°顺时针旋转
ctx.closePath(); // 闭合
// 扇形
ctx.moveTo(200, 100);
ctx.arc(200, 100, 50, rads(-60), rads(0), false); // 顺时针
ctx.closePath(); // 闭合
ctx.moveTo(325, 100);
ctx.arc(325, 100, 50, rads(-60), rads(0), true); // 逆时针
ctx.closePath(); // 闭合
// 直线+圆弧
ctx.moveTo(450, 50); // 从上边的中点开始
ctx.arcTo(500, 50, 500, 150, 30); //添加部分上边和右上角
ctx.arcTo(500, 150, 400, 150, 30); // 添加右上角和右下角
ctx.arcTo(400, 150, 400, 50, 10); // 添加底边和左下角
ctx.arcTo(400, 50, 500, 550, 0); // 添加左边和左上角
ctx.closePath(); // 闭合
// 二次贝塞尔曲线
ctx.moveTo(75, 250)
ctx.quadraticCurveTo(100, 200, 175, 250); // 画一条以一直到点(175, 250)结束的曲线
ctx.fillRect(100 - 3, 200 - 3, 6, 6); // 标记控制点(100, 200)
// 三次贝塞尔曲线
ctx.moveTo(200, 250);
ctx.bezierCurveTo(220, 220, 280, 280, 300, 250); // 画一条以一直到点(300, 250)结束曲线
ctx.fillRect(220 - 3, 220 - 3, 6, 6); // 标记控制点
ctx.fillRect(280 - 3, 280 - 3, 6, 6);
ctx.fillStyle = '#aaa';
ctx.lineWidth = 5;
ctx.fill();
ctx.stroke();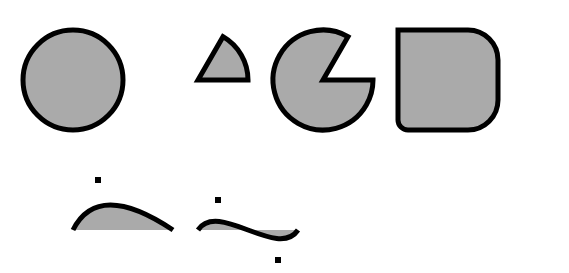
(效果图)
6、矩形
- fillRect(x,y,width,height): 使用当前点的fillStyle来填充指定的矩形
- 参数:
- x:矩形左上角的x坐标
- y: 矩形左上角的y坐标
- width: 矩形的宽度
- height: 矩形的高度
- 参数:
- strokeRect(x,y,width,height): 使用当前的strokeStyle和其他线段的属性来勾勒指定矩形的外边框,参数与fillRect()相同
- clearRect(x,y,width,height): 清除矩形,参数与fillRect()相同
- rect(x,y,width,height): 绘制矩形,会对当前路径产生影响,会在指定的矩形添加到当前路径的子路径中,参数与fillRect()相同
7、颜色、透明度、渐变、图案(占坑)
8、文本
- fillText(text, x, y, [maxWidth]):在画布上绘制填色的文本
- 参数:
- text: 文案
- x: 开始绘制文本的x坐标(相对于画布)
- y: 开始绘制文本的y坐标(相对于画布)
- maxWidth: 可选,允许的最大文本宽度
- 参数:
- strokeText(text, x, y, [maxWidth]): 在画布上绘制文本(无填充色),参数与fillText()相同
9、裁剪
clip():
- 当调用此方法时,当路径自身就会裁剪到当前裁剪区域中,之后,被裁剪的路径就变成了新的裁剪区域,也就是说,此方法只会缩小裁剪区域,永远不会放大裁剪区域,由于没有提供重置裁剪区域的方法,因此在调用clip()之前通常要调用save()方法,以便于恢复为裁剪区域
1
2
3
4
5
6
7
8
9
10
11
12
13
14
15
16
17
18
19
20
21
ctx.font = 'bold 60pt san-serif'; // 设置字体
ctx.lineWidth = 2; // 线段宽度
ctx.strokeStyle = '#000'; // 线段颜色
// 勾勒矩形轮廓和文本轮廓
ctx.strokeRect(175, 20, 50, 325);
ctx.strokeText = ('<canvas>', 15, 330);
// note:polygon方法见上面的示例
polygon(ctx, 3, 200, 225, 200); // 大三角形
polygon(ctx, 3, 200, 225, 100, 0, true); // 小三角形
ctx.clip(); // 将该路径定义成裁剪区域
ctx.lineWidth = 10; // 另外5个像素的线段被裁剪了
ctx.stroke();
ctx.fillStyle = '#aaa'; // 填充颜色
ctx.fillRect(175, 25, 50, 325); // 填充竖直的条带
ctx.fillStyle = '#888'; // 填充颜色
ctx.fillText('<canvas>', 15, 330); // 填充文本
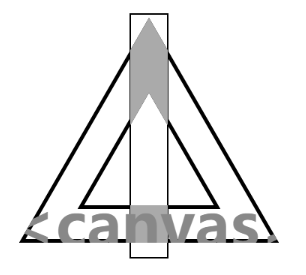
(效果图)
- 当调用此方法时,当路径自身就会裁剪到当前裁剪区域中,之后,被裁剪的路径就变成了新的裁剪区域,也就是说,此方法只会缩小裁剪区域,永远不会放大裁剪区域,由于没有提供重置裁剪区域的方法,因此在调用clip()之前通常要调用save()方法,以便于恢复为裁剪区域
10、阴影
shadowOffsetX属性和shadowOffsetY属性总是默认在坐标空间中的度量的,不受rotate()和scale()方法影响。
1
2
3
4
5
6
7
8
9
10
11
12
13
14
15
// 不明显的阴影
ctx.shadowColor = 'rgba(100, 100, 100, .4)'; // 半透明灰色
ctx.shadowOffsetX = ctx.shadowOffsetY = 3; // 偏移阴影到右下角部分
ctx.shadowBlur = 5; // 柔化阴影的边缘
ctx.lineWidth = 10;
ctx.strokeStyle = 'blue';
ctx.strokeRect(100, 100, 300, 200); // 绘制一个巨型
ctx.font = 'Bold 36pt Helvetica';
ctx.fillText('Hello World', 115, 225); //绘制文本
ctx.shaowOffsetX = ctx.shadowOffsetY = 20;
ctx.shadowBlur = 10;
ctx.fillStyle = 'red'; // 绘制一个红色的矩形
ctx.fillRect(50, 25, 200, 65); // 该红色矩形浮在蓝色方框上面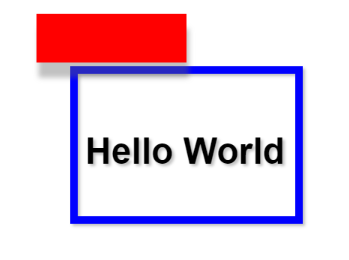
(效果图)
11、图片
- drawImage(): 将源图片(或源图片中的矩形区域中)的像素内容复制到画布上,有需要的时候可以对图片进行缩放和旋转
- 语法一:drawImage(img,x,y)
- 语法二:drawImage(img,x,y,width,height)
- 语法三:drawImage(img,sx,sy,swidth,sheight,x,y,width,height);
- 参数说明:
- img: 图像、画布或视频
- sx: 开始剪切的 x 坐标位置
- sy: 开始剪切的 y 坐标位置
- swidth: 被剪切图像的宽度
- sheight: 被剪切图像的高度
- x: 在画布上放置图像的 x 坐标位置
- y: 在画布上放置图像的 y 坐标位置
- width: 要使用的图像的宽度
- height: 要使用的图像的高度
案例
1
2
3
4
5
6
7
8
9
10
11
12
13ctx.moveTo(5, 5);
ctx.lineTo(45, 45);
ctx.lineWidth = 8;
ctx.lineCap = 'round';
ctx.stroke();
ctx.translate(50, 100);
ctx.rotate(-45 * Math.PI / 180); // 让线段变得更直
ctx.scale(10, 10); // 将它放大到能够看到每个像素
ctx.drawImage(ctx.canvas,
0, 0, 50, 50, // 源矩形区域 未变换
0, 0, 50, 50) // 目标矩形区域 变换过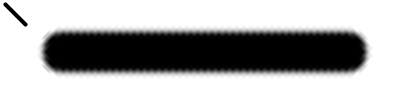
(效果图)
- toDataUrl():画布自身的方法,将画布内容以png图片的形式返回,同时编码成一个字符串数据,用url表示,返回的url可以在
<img>元素中使用,同时也可以实现画布静态截图的功能;此方法有一个很重要的安全限制,为了避免跨域的信息泄露,toDataURL()方法无法在非”origin-clean”的<canvas>上使用。1
2
3var img = document.createElement('img');
img.src = canvas.toDataURL();
document.body.appendChild(img);
12、合成(占坑)
13、像素操作
- getImageData(): 返回 ImageData 对象,该对象拷贝了画布指定矩形的像素数据,同样收同源安全策略的限制
- putImageData(): 方法将图像数据(从指定的 ImageData 对象)放回画布上
- 示例(?)
1
2
3
4
5
6
7
8
9
10
11
12
13
14
15
16
17
18
19
20
21
22
23
24
25
26
27
28
29
30
31
32
33
34
35
36
37
38// 使用ImageData实现动态模糊
// 将矩形区域的像素向右进行涂抹
// 来产生动态模糊效果,就好像物体正在从右向左移动
// n必须要>= 2, 该值越大,涂抹区域就越大
// 矩形是在默认坐标中指定的
function smear(c, n, x, y, w, h){
// 获取表示矩形区域内像素的ImageData对象来实现涂抹效果
let pixels = c.getImageData(x, y, w, h);
// 就地实现涂抹效果并只需要ImageData对象数据
// 一些图片处理算法要求额外的ImageData对象来存储变换后的像素值
// 如果需要输出缓冲区,可以以如下方式创建一个新的同样尺寸的ImageData对象
let output_pixels = c.createImageData(pixels);
// 这些尺寸可能和w和h之类的参数不同,有可能是每个css像素要表示多个设备像素
let width = pixels.width, height = pixels.height;
// data变量包含所有原始的像素信息,从左到右, 从上到下
// 每个像素按照RGBA的顺序共占据4个字节
let data = pixels.data;
// 每一行的一个像素之后的像素都是通过将其色值替换成其色素值得1/0 + 原色素值的m/n
let m = n - 1;
for(let row = 0; row.height; row++){
let i = row * width * 4 + 4;
for(let col = 1; col <width; col++, i+= 4){
data[i] = (data[i] + data[i - 4] * m) / n;
data[i + 1] = (data[i + 1] + data[i - 3] * m) / n;
data[i + 2] = (data[i + 2] + data[i - 2] * m) / n;
data[i + 3] = (data[i + 3] + data[i - 1] * m) / n;
}
}
// 将涂抹过的图片数据复制回画布相同的位置
c.putImageData(pixels, x, y);
}
14、命中检测
- isPointInPath(x, y): 确定一个指定的点是否落在(或者在边界上)当前路径中,返回true(落在当前路径中)|false(没落在当前路径中)
- 示例
1
2
3
4
5
6
7
8
9
10
11
12
13
14
15
16
17
18
19
20
21
// 如果鼠标事件发生指定的CanvasRenderingContext2D对象的当前路径上则返回true
function hitpath(context, event){
// 从<canvas>对象中获取<canvas>元素
let canvas = context.canvas;
// 获取画布尺寸和位置
let bb = canvas.getBoundingClientRect();
// 将鼠标事件坐标通过转换和缩放变化成画布坐标
let x = (event.clientX - bb.left) * (canvas.width / bb.width);
let y = (event.clientY - bb.top) * (canvas.height / bb.height);
// 用这些变化后的坐标来调用isPointInPath()方法
return context.isPointInPath(x, y);
}
canvas.onclick = function(){
if(hitpath(this.getContext('2d'), event){
alert('Hit');
}
}
以上源码地址(https://github.com/frontYang/study/tree/master/canvas/cases)
三、个人实践
1、圆形占比
1 | /* 绘制圆环占比 */ |
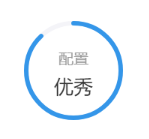
(圆环)
2、仪表盘
1 |
|
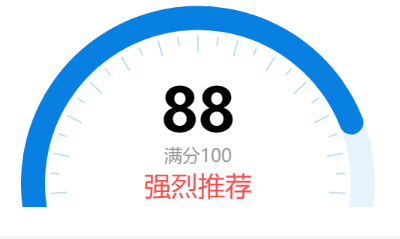
(效果图)
3、折线图
1 | // 画折线图 |
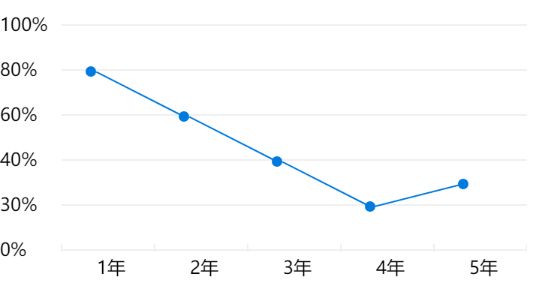
(效果图)